


"Now You See It" is the latest book by author Stephen Few. The description says this book is a companion to "Show Me The Numbers," which is a favorite book of mine. "Show Me The Numbers" is about building charts and tables that will help you show others what you see in your data. "Now You See It" is about helping you to find new ways to display your data for your own analysis. Before you can show others your data you need to understand it yourself, and that's where this book fits in.
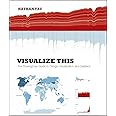
Creating charts is front and center as the focus of this book. "Show Me The Numbers" focused on charts and tables that could be built with simple tools such as Excel. Now You See It shows you the types of analysis you can do when you employee more advanced software such as Tableau and R. Some of the illustrations are really cool to look at and inspirational, even if I will never have the tools or time to prepare my own version of them.
"Now You See It" is broken up into 3 sections:
In Part 1 - Building Core Skills for Visual Analysis. Stephen Few covers the history of information visualization, the basics of analysis, and how we perceive data. There is some overlap with "Show Me The Numbers," but it's only one chapter, and not a deal breaker for me. I found the history of information visualization chapter interesting, and I imagine that in 50-100 years there are going to be new kinds of visualization methods available that we haven't even thought of yet.
In chapter 4, Analytical Interaction and Navigation, the author covers the role of good software in the data analysis process. He lists a few requirements that good software should have, and in many cases popular software such as Excel fall short. This is when you realize that learning another program like R could be useful. I almost feel like this chapter was written for software developers who are trying to create their own data analysis software, so if you're in that camp this is your book.
Part 2 - Honing Skills for Diverse Types of Visual Analysis, goes in depth with various types of charts that you can use to analyze your data. There is a chapter for each of the major types of visual analysis: Time Series, Ranking and Part-to-Whole, Deviation, Distribution, Correlation, and Multivariate.
Within each chapter Stephen Few shows you which types of patterns you should look for in your data and shows you what those patterns mean. He then shows you different ways of displaying the data, which can range from simple Excel charts to complex visualizations which could belong in a magazine. Finally he finishes each chapter with a list of best practices for analyzing the data, such as scaling chart intervals properly or using logarithmic scales to compare the percent change of data with different starting points (look at almost any stock market graph to see a logarithmic chart in action).
These chapters form nearly 50% of the book, and could be very useful reading to a student getting started with statistics, or anyone else who is not completely comfortable with numbers.
Part 3 - Further Thoughts and Hopes. The first chapter of the book opens with the history of information visualization, and the final chapters conclude with the author's thoughts on the future. As computing power gets stronger and the internet becomes more ubiquitous new innovations are in the works, and some of them are covered here.
Recommendation
I finished reading this book about a week ago, and at first I didn't think much of it. I already have a strong analytical background and didn't feel like I got much out of this book in terms of learning anything new. But after a few days I noticed that I starting thinking about problems differently - I started thinking about how I could present them in a visual manner, and I started sharing my simple charts with others.
I am finding that being able to throw together a chart quickly and effectively is extremely helpful for me and a great way to share results with coworkers. Despite having seen almost everything in this book before, reading it has got me thinking about using charts more to analyze data. It is also the kick I needed to start learning to do charts in SAS so I can expand my visualizations beyond what Excel can do.
The benefits of this book may not be immediately apparent like "Show Me The Numbers,", but if you give it some time to sink in I think you will start thinking of new ways to visualize your data. The charts shown by Few in this book are, for the most part, accessible to those of us in business, versus Edward Tufte who emphasizes charts created with design tools such as Adobe Illustrator. There are some examples shown in Tableau and Spotfire, which are both quite expensive. But there are also illustrations created in R, which is free. Of course if you are going to use those programs you have to learn to use them, but that will only increase your job appeal that much more.
If you work as a business analyst and are looking for practical ways to expand your knowledge and abilities, I highly recommend this book.
Enjoy fast, free delivery, exclusive deals, and award-winning movies & TV shows with Prime
Try Prime
and start saving today with fast, free delivery
Download the free Kindle app and start reading Kindle books instantly on your smartphone, tablet, or computer - no Kindle device required.
Read instantly on your browser with Kindle for Web.
Using your mobile phone camera - scan the code below and download the Kindle app.

Something went wrong. Please try your request again later.
There is a newer edition of this item:


Discover the latest buzz-worthy books, from mysteries and romance to humor and nonfiction. Explore more
Frequently bought together
$25.31
Get it as soon as Friday, May 17
Only 1 left in stock - order soon.
+
Total price:
To see our price, add these items to your cart.
Choose items to buy together.
Customers who viewed this item also viewed
Page 1 of 1 Start overPage 1 of 1
About the author
Follow authors to get new release updates, plus improved recommendations.

Reviews with images

Top reviews from other countries


MR MICHAEL MINTO
Great Book for data visualization theory
Reviewed in Australia on February 11, 2021
John Schaub
Great introduction to Data Visualization
Reviewed in Canada on September 8, 2014JavJav
Esencial en la forma en que mostramos datos.
Reviewed in Spain on July 14, 2014